
Benchmarks and measured performance
Use published measurements to understand where scan time and allocations go, then measure your own repository before choosing CI capacity or deadlines. The current benchmarks cover CLI/MCP’s solution-analysis pipeline, with all six rules selected. They do not measure compiler-analyzer latency in an IDE.
Published results
Section titled “Published results”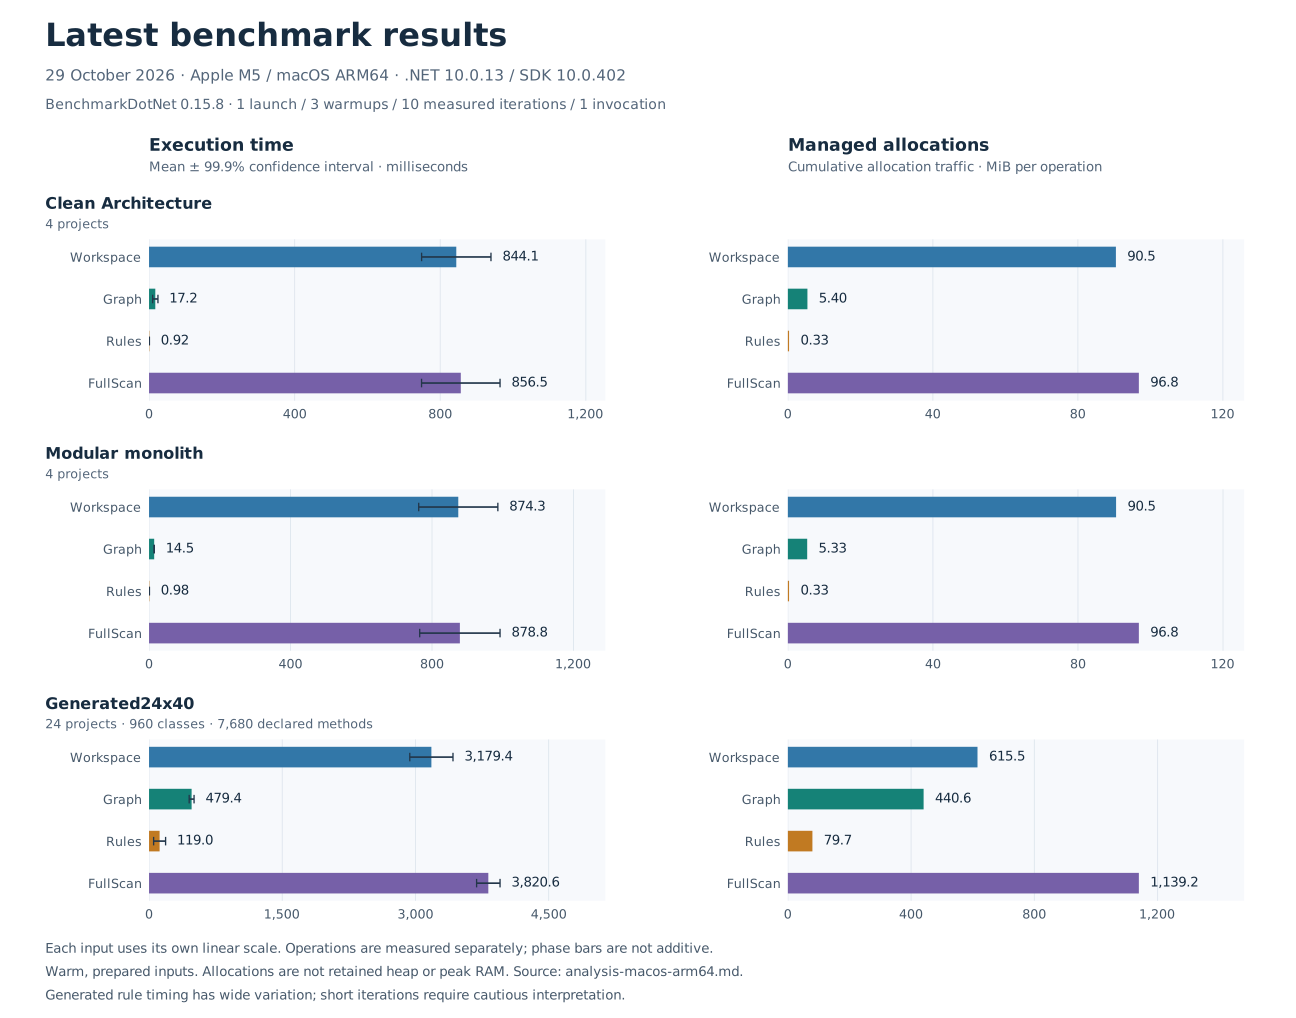
The chart is derived from the unmodified BenchmarkDotNet report. Open the chart at full size to inspect individual values without shrinking the labels. That report contains exact means, medians, ranges, confidence intervals, allocation and GC counts. These results were measured on 29 October 2026 with BenchmarkDotNet 0.15.8, Apple M5 (10 cores), macOS 27.0.1, .NET 10.0.13 and SDK 10.0.402.
The OS declined high-priority scheduling and some short iterations triggered minimum-iteration-time warnings. Inspect the variation and measurement scope alongside the chart. These are observations from that environment, not a latency promise for other hardware or repositories.
What was measured
Section titled “What was measured”| Input | Size | Architecture |
|---|---|---|
| Clean Architecture | 4 projects | Domain, Application, Infrastructure and Host |
| Modular monolith | 4 projects | Orders and Billing, each with a contract and application |
| Generated24x40 | 24 projects, 960 authored C# files, 7,680 methods | 24 modules, one layer, 23 direct project references in an acyclic chain |
The generated input includes implementation-boundary findings. Completed analysis does not imply a passed architecture gate.
| Operation | What its timing includes |
|---|---|
| Workspace | Loading and disposing a fresh workspace, with compilation coverage validation |
| Graph | Normalization and dependency extraction/aggregation from prepared Roslyn context |
| Rules | Evaluating all six rules against a prepared graph |
| FullScan | The solution-analysis service, including its owned workspace disposal |
Each input/operation was measured separately with three warmups, ten measured iterations and one invocation per iteration. Do not add the phase timings or allocations to predict a full scan: their prepared state and lifetimes differ.
What the results mean for adoption
Section titled “What the results mean for adoption”Workspace discovery, compilation and coverage validation dominate latency in the larger measured input. Before attributing a slow scan to rules, check its restore context, SDK selection, generators and project inventory. The local telemetry guide can identify which phase dominates your run.
The runs use warm, prepared inputs. They exclude process startup, policy parsing, normal package restore and report rendering. Git change analysis performs two full scans plus snapshot/cache-only restore work and is not directly benchmarked. Cycle-heavy graph performance is not established by these acyclic inputs.
Allocated is managed allocation traffic per operation. It is not retained heap,
native memory, child MSBuild memory or peak process RAM. BenchmarkDotNet’s GC counts
are normalized to 1,000 operations. Do not use these values directly as runner RAM
requirements.
Compare your own runs meaningfully
Section titled “Compare your own runs meaningfully”Keep the input, configuration/framework, tool version, SDK, dependency assets and generated content stable. Measure comparable warm/cold conditions and repeat runs with normal build activity accounted for. Record both completion and gate outcome; an unexpectedly fast incomplete scan is not a performance improvement.
The source repository’s measured budgets are investigation thresholds with an initial noise allowance, not universal CI service levels or an automatic performance gate. Keep normal build/tests and architecture validation as correctness gates. See telemetry, workspace loading, and engine coverage when planning adoption.